How to Calculate Acceleration From a Velocity Time Graph 2026
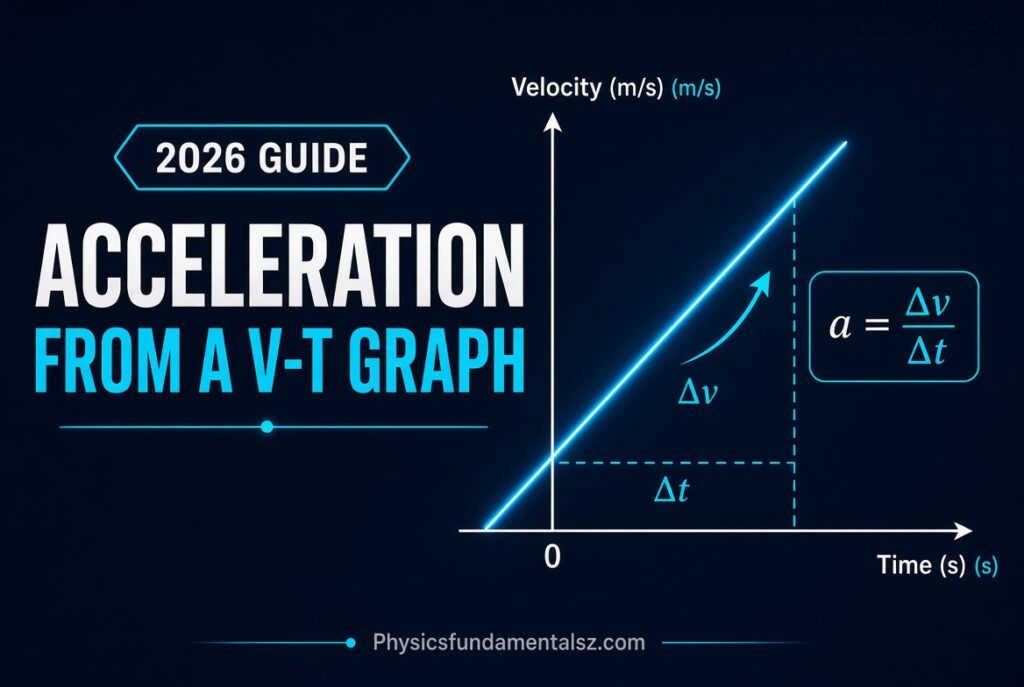
How to Calculate Acceleration From a Velocity Time Graph: To calculate acceleration from a velocity time graph, find the slope of the line. Divide the change in velocity (rise) by the change in time (run): a = Δv / Δt. A steeper line means greater acceleration.
Table of Contents
What Is a Velocity Time Graph

A velocity time graph plots an object’s velocity on the y-axis against time on the x-axis. It shows how fast something is moving at every moment.
The shape of the line tells you how the motion is changing. A straight line means steady acceleration, while a curve means the acceleration itself is changing.
How to Calculate Acceleration From a Velocity Time Graph
The Formula for Acceleration From a Graph
Acceleration equals the slope of the velocity time graph. The formula is written as a = Δv / Δt.
Here, Δv is the change in velocity, and Δt is the change in time. This is the same idea as calculating slope in basic algebra, just applied to motion.
Step-by-Step Method to Calculate Acceleration
Follow these steps to read acceleration directly from a velocity time graph.
- Pick two clear points on the line.
- Read the velocity value at each point.
- Subtract to find Δv (final velocity minus initial velocity).
- Read the time value at each point.
- Subtract to find Δt (final time minus initial time).
- Divide Δv by Δt to get acceleration.
Worked Example: Constant Acceleration
Suppose a car’s velocity increases from 10 m/s to 30 m/s over 4 seconds on the graph. Here, Δv = 30 − 10 = 20 m/s.
Δt = 4 seconds. Using a = Δv / Δt, the acceleration equals 20 / 4 = 5 m/s².
Worked Example: Negative Acceleration
Now imagine velocity drops from 40 m/s to 10 m/s over 5 seconds. Δv = 10 − 40 = −30 m/s.
Dividing by Δt = 5 seconds gives a = −6 m/s². The negative sign shows the object is slowing down, also called deceleration.
How to Read Different Line Shapes
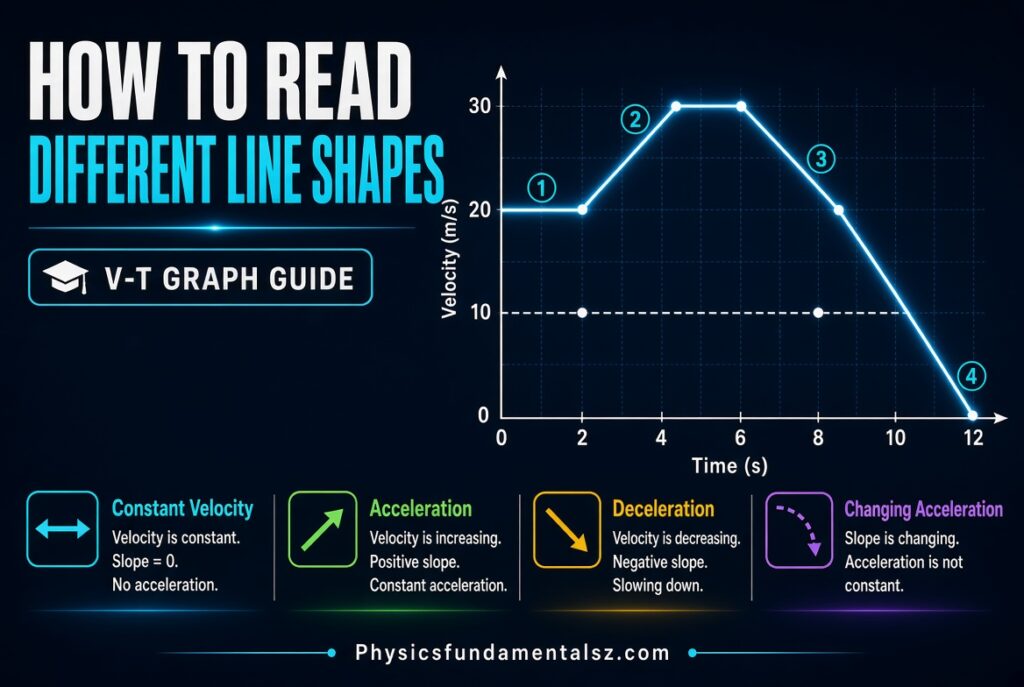
| Line Shape | What It Means | Acceleration Type |
|---|---|---|
| Straight line going up | Speed increasing steadily | Constant positive acceleration |
| Straight line going down | Speed decreasing steadily | Constant negative acceleration |
| Flat horizontal line | Speed staying the same | Zero acceleration |
| Curved line getting steeper | Acceleration increasing over time | Non-uniform acceleration |
| Curved line flattening out | Acceleration decreasing over time | Non-uniform acceleration |
Calculating Acceleration From a Curved Graph
A curved velocity time graph shows changing acceleration. In this case, you cannot use one single slope value for the whole graph.
Instead, draw a tangent line at the exact point you care about. The slope of that tangent gives the instantaneous acceleration at that moment.
Difference Between Average and Instantaneous Acceleration
Average acceleration uses two points far apart on the graph. It gives the overall rate of change over that time span.
Instantaneous acceleration uses the slope at a single point, found through a tangent line. It tells you the exact acceleration at that specific instant.
Common Mistakes to Avoid
- Confusing the y-axis and x-axis values when reading the graph.
- Forgetting to include units in the final answer.
- Ignoring the negative sign when velocity is decreasing.
- Treating a curved graph as if it has constant acceleration.
- Mixing up velocity time graphs with distance time graphs.
Velocity Time Graph vs Distance Time Graph
| Feature | Velocity Time Graph | Distance Time Graph |
|---|---|---|
| Y-Axis | Velocity | Distance |
| Slope Represents | Acceleration | Speed or velocity |
| Area Under Line Represents | Displacement | Not applicable |
| Straight Line Meaning | Constant acceleration | Constant speed |
Real-World Applications
Engineers use velocity time graphs to test vehicle braking performance. A steep negative slope shows strong braking deceleration.
Physics students use these graphs to understand motion in free fall, sports science, and rocket launches. The same slope method applies in every case.
Expert Tip

Always check the graph’s scale before calculating anything. A misread axis value is the most common reason students get the wrong acceleration answer.
Also Read:
- Newton’s Laws of Motion Explained
- Transverse Waves Explained
- What Is Energy?
- Projectile Motion Complete Guide
- Wave Speed, Frequency & Wavelength
- Conservation of Momentum
- Projectile Motion Formula for Angled Launch Explained
- Difference Between Speed and Velocity With Examples
- Mass Energy Equivalence Real Life Examples
- Nuclear Decay Equations Explained Simply
- How to Derive Wave Speed Formula
- Photoelectric Effect Equation Explained
- What Is the Formula for Conservation of Momentum?
- E=mc2 Explained for Beginners
- De Broglie Wavelength Calculator
- Kinetic Energy Calculator Physics
- Ohm’s Law Calculator Solve for Current
- Half Life Calculator With Steps
- Wave Speed Calculator Frequency Wavelength
- Momentum Calculator Physics
- Ideal Gas Law Calculator With Steps
- Projectile Motion Calculator With Angle
- Heisenberg Uncertainty Principle Explained Simply
- Bohr Model of the Atom
- De Broglie Wavelength Formula, Derivation & Examples
Frequently Asked Questions (FAQs)
How do you calculate acceleration from a velocity time graph?
You calculate the slope of the line using a = Δv / Δt. This means dividing the change in velocity by the change in time.
What does the slope of a velocity time graph represent?
The slope represents acceleration. A steeper slope means a higher rate of change in velocity.
What does a straight line on a velocity time graph mean?
A straight line means the object has constant, uniform acceleration. The slope stays the same at every point on the line.
What does a flat horizontal line mean on a velocity time graph?
A flat horizontal line means the velocity is not changing. This means the acceleration is zero.
What does a negative slope mean on a velocity time graph?
A negative slope means the object is slowing down. This is called deceleration or negative acceleration.
How do you find acceleration from a curved velocity time graph?
Draw a tangent line at the specific point you want to measure. The slope of that tangent gives the instantaneous acceleration.
What is the difference between average and instantaneous acceleration?
Average acceleration is measured between two points far apart on the graph. Instantaneous acceleration is measured at a single exact point using a tangent line.
What are the units for acceleration on a velocity time graph?
The standard SI unit for acceleration is meters per second squared, written as m/s². This comes from dividing velocity units (m/s) by time units (s).
Does the area under a velocity time graph represent acceleration?
No, the area under a velocity time graph represents displacement, not acceleration. Acceleration comes only from the slope of the line.
Can acceleration be zero on a velocity time graph?
Yes, acceleration is zero whenever the line is perfectly horizontal. This shows the object is moving at a constant velocity.
How is a velocity time graph different from a distance time graph?
A velocity time graph’s slope gives acceleration, while a distance time graph’s slope gives speed. The y-axis values and their meaning are completely different.
What is Δv in the acceleration formula?
Δv stands for the change in velocity. It is calculated as final velocity minus initial velocity.
What is Δt in the acceleration formula?
Δt stands for the change in time. It is calculated as final time minus initial time.
Why is acceleration negative when velocity decreases?
Acceleration becomes negative because Δv is negative when final velocity is smaller than initial velocity. The negative sign shows direction of change, not just magnitude.
What is a common mistake when reading velocity time graphs?
A common mistake is misreading the axis scale or units. This leads to incorrect Δv and Δt values, which throws off the entire acceleration calculation.
How do engineers use velocity time graphs in real life?
Engineers use them to study vehicle braking, rocket launches, and machine performance. The slope method reveals exactly how fast something speeds up or slows down.
Is acceleration the same as speed?
No, acceleration measures how quickly velocity changes, while speed measures how fast an object moves. They are related but represent different physical quantities.
Conclusion
Calculating acceleration from a velocity time graph comes down to one core idea: acceleration is the slope of the line, found using a = Δv / Δt. Straight lines give constant acceleration, flat lines mean zero acceleration, and curved lines need a tangent line for instantaneous values.
Once you get comfortable reading Δv and Δt correctly, this becomes one of the fastest ways to understand motion at a glance. Practice with real graphs, including negative slopes and curves, to build full confidence in solving any kinematics problem.